How Face Score Is Calculated: AI Rating Explained
2 min read
By Lookmax Analyzer Team — Updated Mar 3, 2026
How Is Your Face Score Calculated?
This AI face analysis tool uses 478 facial landmarks to calculate a structured attractiveness score based on symmetry, facial ratios and jawline geometry.
Understanding how your face score is calculated helps you interpret your results more accurately.
Overview#
When you upload a photo, our AI evaluates your face across five key categories:
Each category receives a score between 0–100, and your overall face score is calculated as a weighted average.
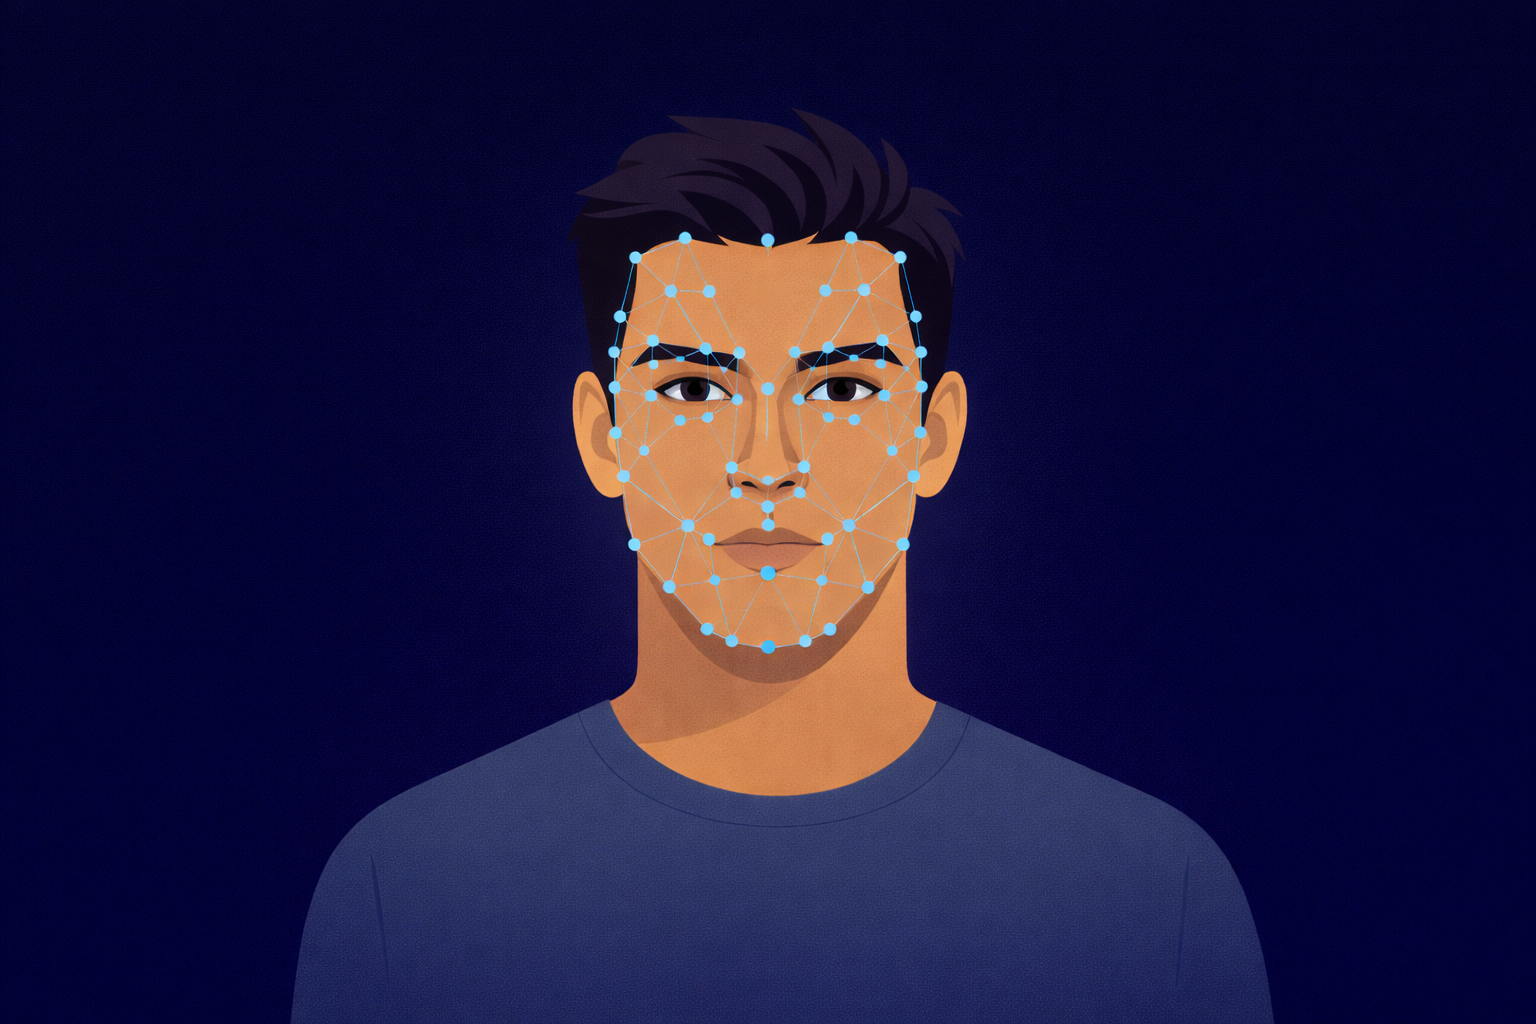
478 facial landmarks detected by our AI model
What We Measure#
1. Jawline
- Jaw angle
- Jaw width relative to face width
- Chin projection
Sharper and well-balanced jaw structures typically increase perceived facial definition.
2. Symmetry
Facial symmetry is one of the most studied traits in attractiveness research. We measure:
- Eye alignment
- Brow positioning
- Jaw cant
- Mouth centering
3. Eyes
- Eye size ratio
- Eye spacing ratio
- Eye openness
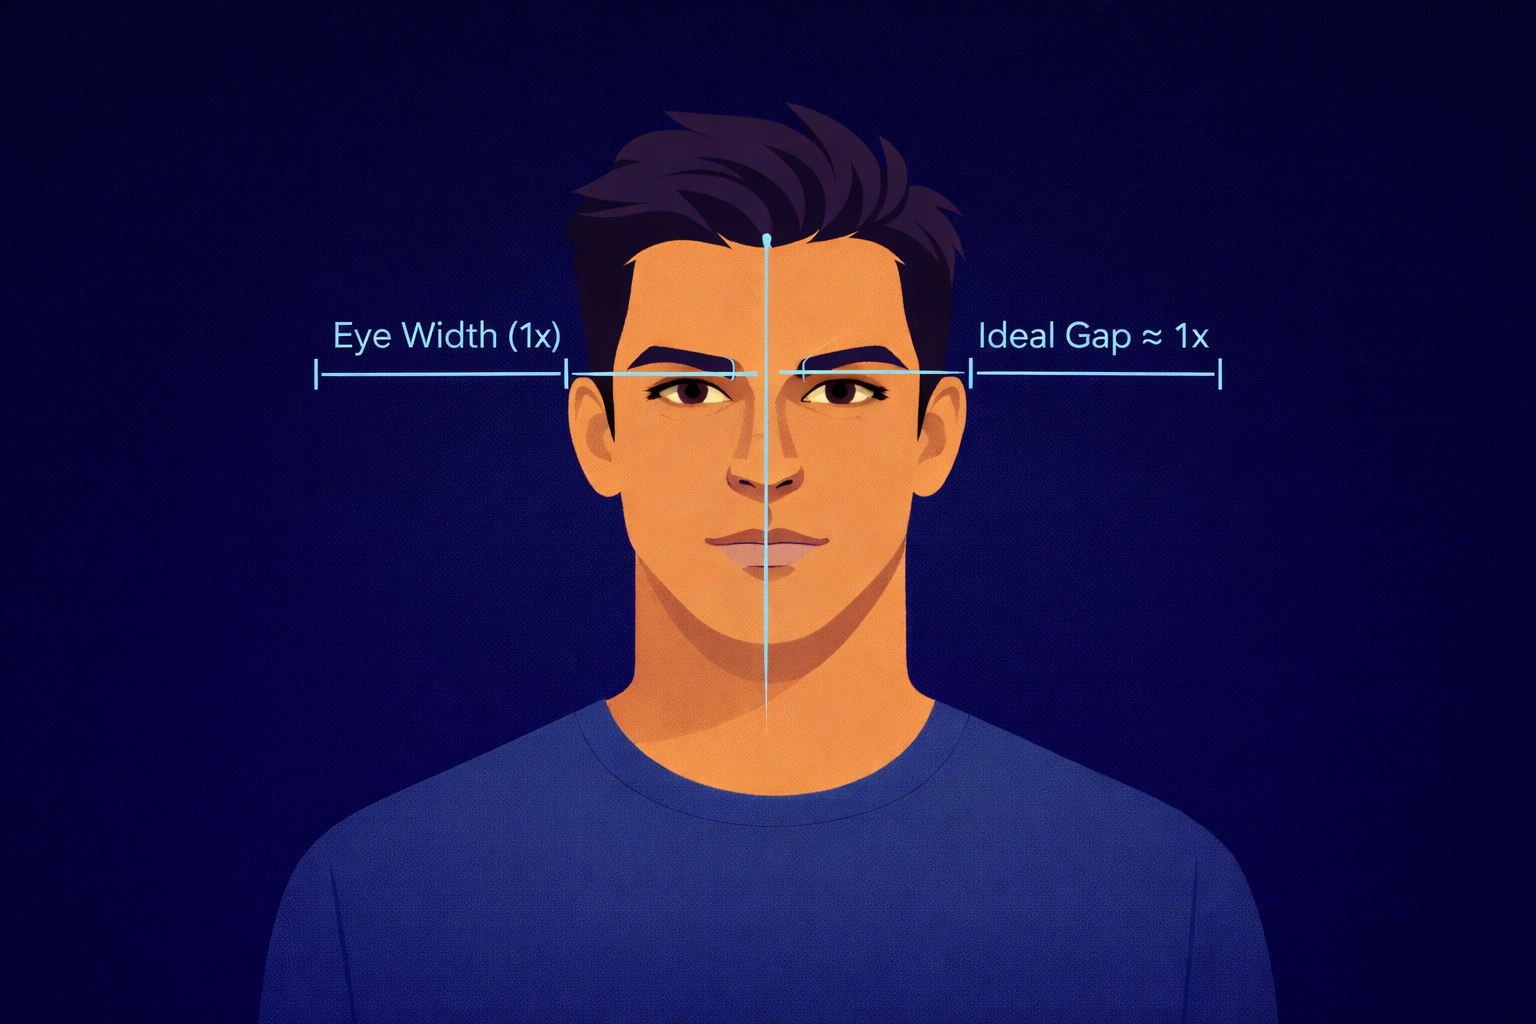
Balanced eye spacing is typically close to one eye-width apart
4. Cheekbones
- Cheek width
- Taper
- Midface prominence
Higher and more defined cheekbones often enhance midface structure.
5. Facial Proportions
- Facial thirds balance
- Vertical harmony
- Horizontal alignment
How Scoring Works#
- Landmark detection (478 facial points)
- Ratio and angle calculation
- Comparison to aesthetic reference ranges
- Smoothed score generation (0–100 scale)
Our model is based on modern facial landmark detection systems used in computer vision research.
Scores are distributed along a curve to avoid unrealistic clustering.
Scores between 75–84 indicate balanced structure. Scores above 85 suggest strong harmony with minor refinements possible.
What Is a Good Face Score?#
Strong — Well-balanced facial structure with minor refinements possible
Balanced — Good harmony across features with some areas for optimization
Emerging Balance — Solid structural foundation with noticeable improvement potential
Developing — Focus on key structural areas to enhance overall harmony
Most users score between 60 and 80. Remember: structural analysis is only one dimension of attractiveness.
Category Weightings#
| Category | Masculine | Feminine | Balanced |
|---|---|---|---|
| Jawline | 30% | 22% | 28% |
| Symmetry | 18% | 22% | 22% |
| Eyes | 20% | 24% | 20% |
| Cheekbones | 20% | 20% | 20% |
| Proportions | 12% | 12% | 10% |
Additionally, bonus points can be earned from: lip ratio, midface ratio, eye depth, canthal tilt, and chin ratio.
How Accurate Is AI Face Analysis?#
- Lighting
- Camera angle
- Facial expression
- Lens distortion
- Image resolution
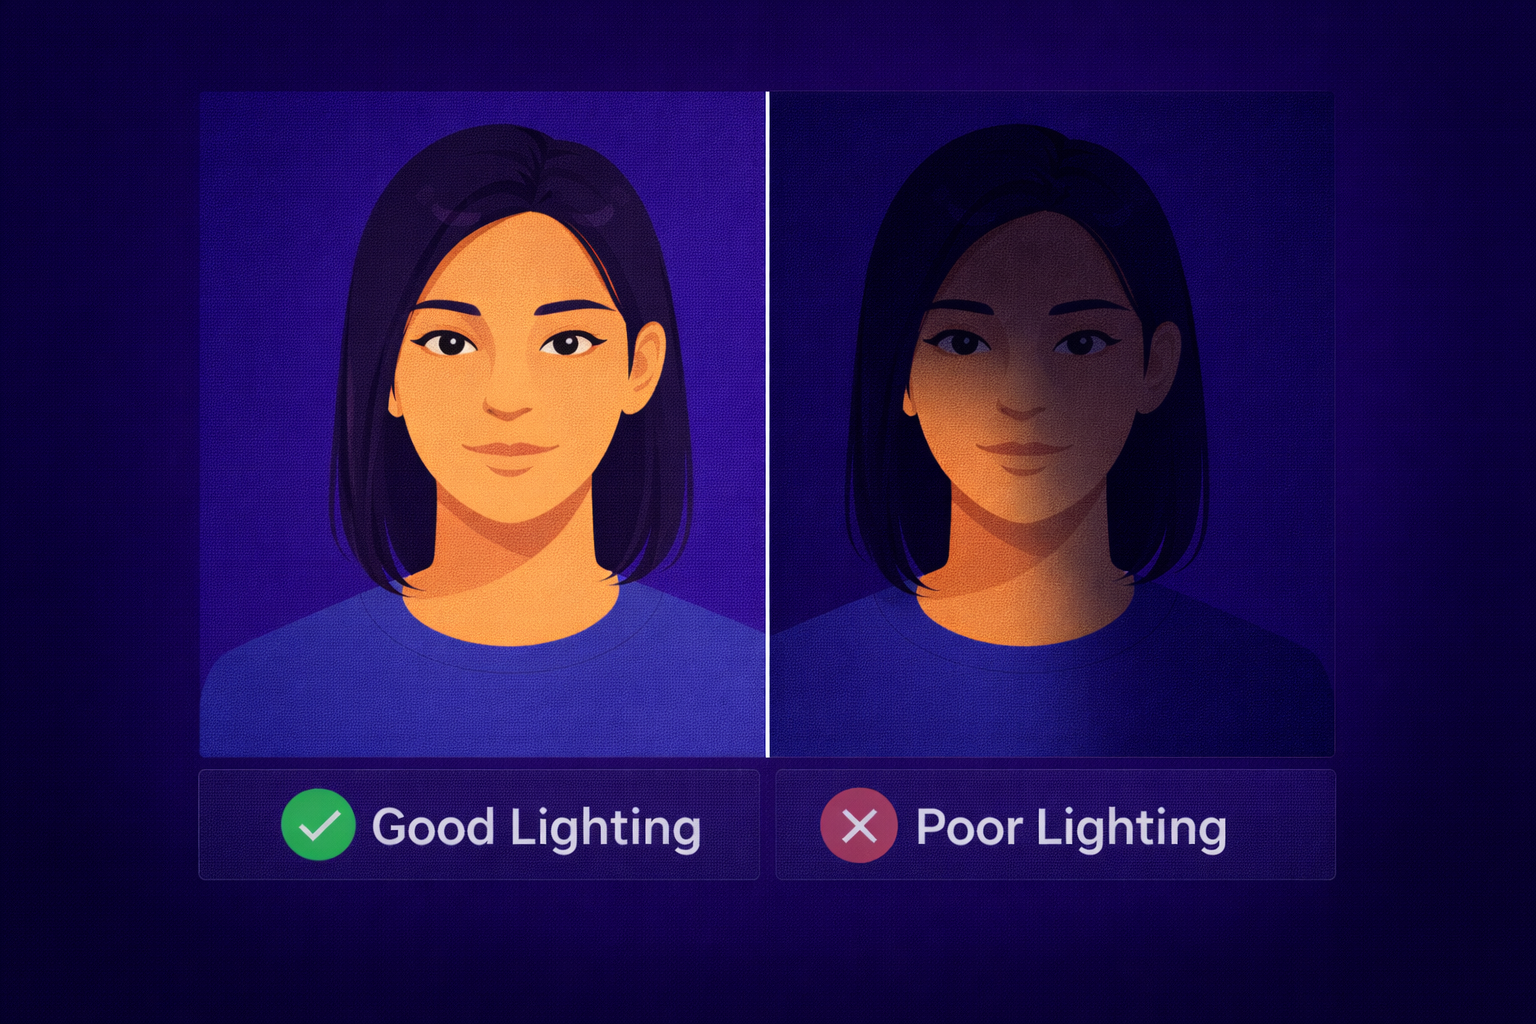
Good lighting (left) vs poor lighting (right) - natural window light works best
2D photo analysis cannot perfectly measure depth. For best results, use straight-on photos in natural lighting.
Best Practices for Accurate Results#
- Use natural window lighting
- Keep a neutral expression
- Face the camera directly
- Avoid wide-angle lens distortion
- Remove glasses
Frequently Asked Questions#
- What is considered a good face score?
- Scores between 75–84 are considered balanced. Scores above 85 indicate strong structural harmony.
- Can I improve my face score?
- Yes. Grooming, posture, skincare, hairstyle, and better photography can improve perceived structure.
- Why did my score change between photos?
- Angle, lighting and facial expression significantly affect ratio calculations.
- Do you store my photos?
- No. All analysis runs locally in your browser.
Sources#
- MediaPipe Face Landmarker documentation
- Google Research: Real-time Facial Surface Geometry from Monocular Video
- PubMed (PMID: 41226978): Advanced 3D Facial Scanning in Orthodontics: A Correlative Analysis of Craniofacial Anthropometric Parameters